質問の時計算の類題をPythonで解いてみました。(^_^;
まず、点Pの角速度[°/s]を求めてみます。点Aを始点(0°)として、時計回りに正、反時計回りに負とすると、
同様にして、点Qの角速度[°/s]を求めると、
よって、点P,Qのt[s]後の位置は、極座標(r,θ)で点Aを(6,0)とすると、それぞれ、
P(6,(-30t)%360),Q(6,60t%360)
で表すことができます。ここで、「%」は、剰余演算子です。(^_^;
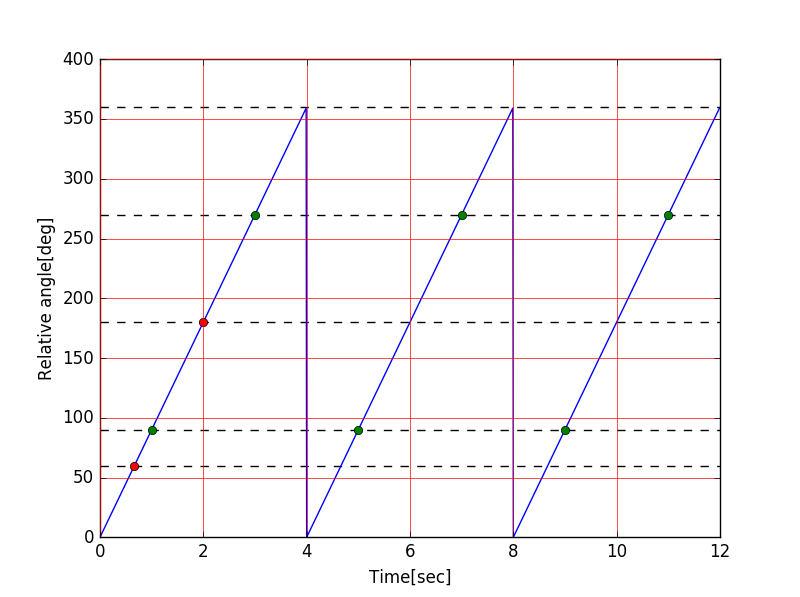
また、t[s]後のPから見たQの相対角度は、90t%360[°]で表すことができます。
(1)△OPQが直角三角形になるのは、∠POQが90°または270°になるときになります。時間と相対角度の表を書くと次のようになります。よって、6回。
| 時間[秒] | 0 | 1 | 2 | 3 | 4 | 5 | 6 | 7 | 8 | 9 | 10 | 11 | 12 |
|---|---|---|---|---|---|---|---|---|---|---|---|---|---|
| 相対角度[°] | 0 | 90 | 180 | 270 | 0 | 90 | 180 | 270 | 0 | 90 | 180 | 270 | 0 |
(3)△OPQが初めて正三角形になるのは、∠POQが60°になるときで、上の表から、0〜1[秒]の間に解はありそうです。(^_^;
求める時間をx[秒]後とすると、次の方程式を解けばよい。
Pythonで検算すると次の通りです。グラフも描いておきます。
● ClockArithSim1.py
# coding: UTF-8
# ClockArithSim1.py

import scipy.optimize as opt

def main():
    N = 12+1
    print(" t   P   Q   Q-P")
    cnt = 0; t180 = N
    for t in range(N):
        p = (-30*t)%360
        q = ( 60*t)%360
        r =  (q-p) %360
        if r==90 or r==(-90)%360:
            cnt+=1
            s = 'o'
        else:
            s = ' '
        print("%2d: %3d,%3d,%3d %s"%(t,p,q,r,s))
        if r==180 and t< t180: t180 = t

    print('')
    print(u'(1) %d[回]'%cnt)
    print(u'(2) %d[秒]'%t180)
    print(u'(3) %g[秒]'%opt.bisect((lambda x: 90*x-60.0),0.0,1.0))

if __name__ == '__main__':
    main()
●実行結果
 t   P   Q   Q-P
 0:   0,  0,  0
 1: 330, 60, 90 o
 2: 300,120,180
 3: 270,180,270 o
 4: 240,240,  0
 5: 210,300, 90 o
 6: 180,  0,180
 7: 150, 60,270 o
 8: 120,120,  0
 9:  90,180, 90 o
10:  60,240,180
11:  30,300,270 o
12:   0,  0,  0

(1) 6[回]
(2) 2[秒]
(3) 0.666667[秒]
● ClockArithSim2.py
# coding: UTF-8
# ClockArithSim2.py

import numpy as np
import matplotlib.pyplot as plt

def main():
    x = np.arange(0, 12, 0.01)
    y = (90*x)%360
    px = [1,3,5,7,9,11]
    py = [(90*t)%360 for t in px]

    plt.plot(x, y)
    plt.plot(px, py,'o')                # 点を描画 (1)
    plt.plot([60.0/90,2],[60,180],'o')  # 点を描画 (2),(3)
    plt.hlines([60,90,180,270,360], 0, 12, linestyles="dashed")  # 破線を描画

##    plt.title('Title')
    plt.xlabel('Time[sec]')
    plt.ylabel('Relative angle[deg]')
    plt.grid(color='r', linestyle='-')
    plt.show()

if __name__ == '__main__':
    main()
※参考URL
●[Python] matplotlibによるグラフ描画 - TIPS - FC2
●Matplotlibでのグラフ描画まとめ | 健忘症の備忘録
●matplotlib入門 - りんごがでている
●1.4. Matplotlib: 作図 − Scipy lecture notes
●つまみぐいプログラミング Python で方程式を数値的に解く
●scipy.optimize.bisect − SciPy v0.18.1 Reference Guide
